


You know GA4 reports are vital tools to make the most out of your website.
You know they will help you gain knowledge on areas such as how your mobile website is performing, where your users are coming from, how engaged users are, and how many leads certain pages are driving.
But to get a quick understanding of how your site is doing – which reports should you be checking out?
Here are our 5 top recommendations:
1. Acquisition Overview Report
Reports > Acquisition > Overview
One of the more important reports in GA4 is the Acquisition Report. With this you can see where your traffic is coming from – organic, paid, direct, referral, and even social media.
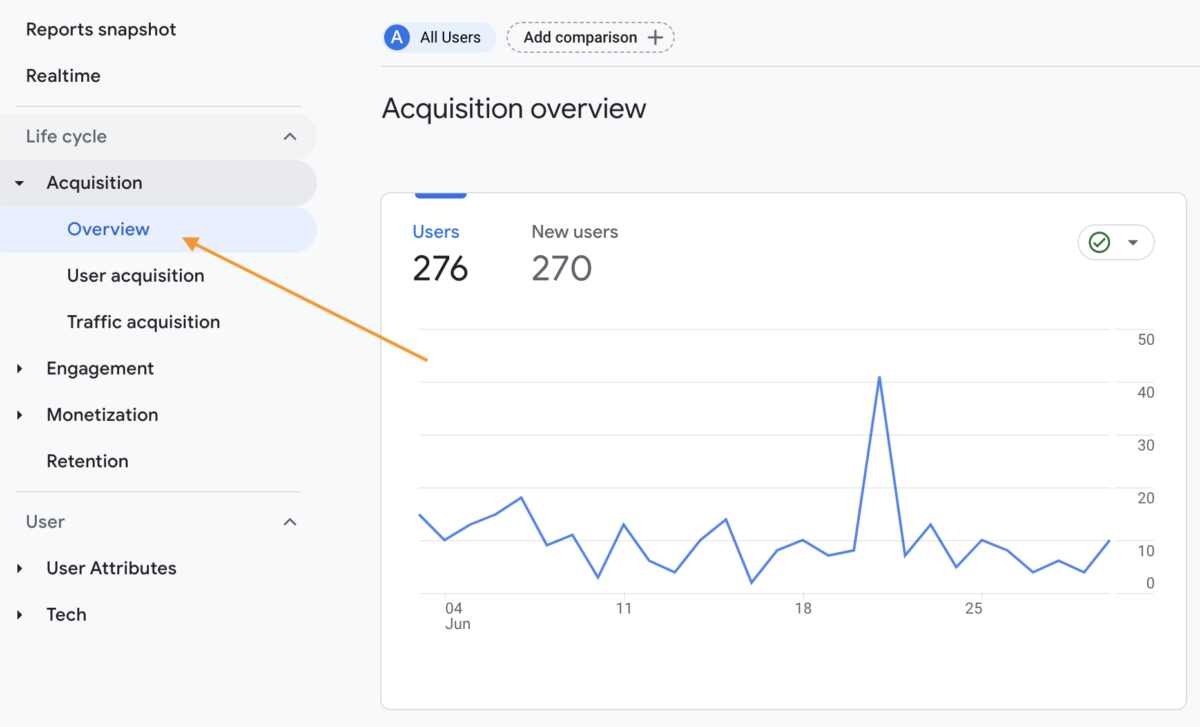
When you’re on the main screen of the Acquisition Overview report, you can click into each category for more details. From there, you can see how many users you’ve had, how engaged they were and if they converted.
These statistics will hep you decide which channels to optimise. If traffic or engagement is down year-over-year, you’ll know where to start making changes.
2. Landing Pages Report
Reports > Engagement > Landing Pages
The next report worth checking out is the Landing Pages report.
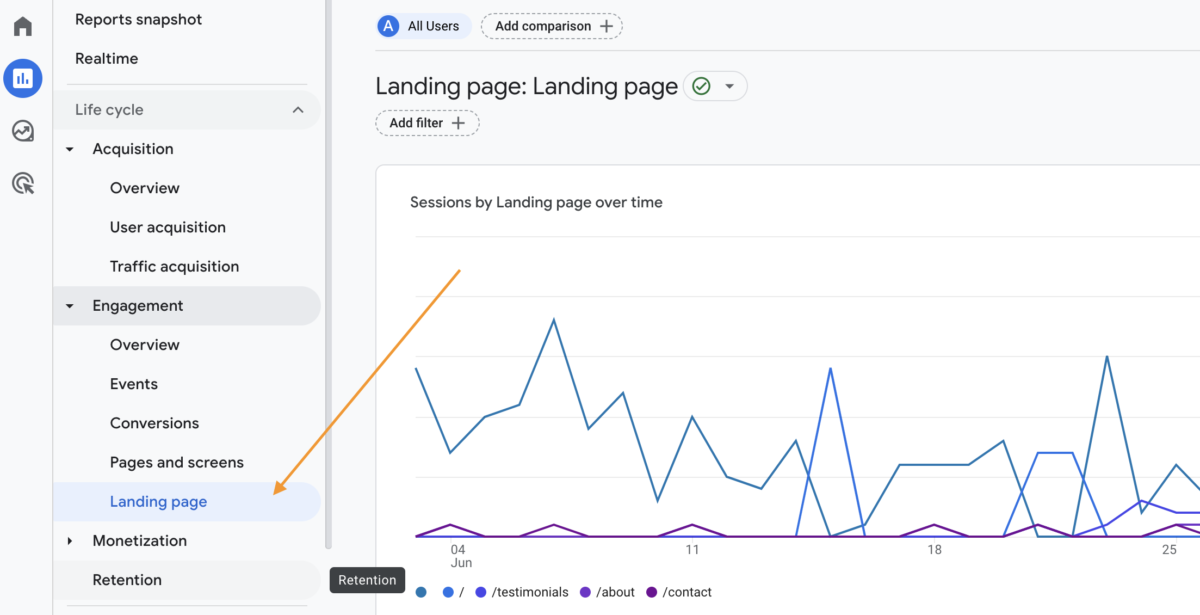
This will show you what page is most often landed on and where users are coming from.
It shows you how many leads are gained from the first page a user lands on plus how many people land on your page and interact with your site versus those who leave right away.
If a lot of visitors are leaving a certain page right away, you may want to make that page more engaging or lower page load time to increase retention.
3. Pages & Screens
Reports > Engagement > Pages & Screens
The behaviour reports in Universal Analytics allowed us to look at our site content to see what pages people are visiting.
GA4 unifies website pages and app screens into one reporting area called “Pages and Screens” which is found in the Engagement section of GA4.
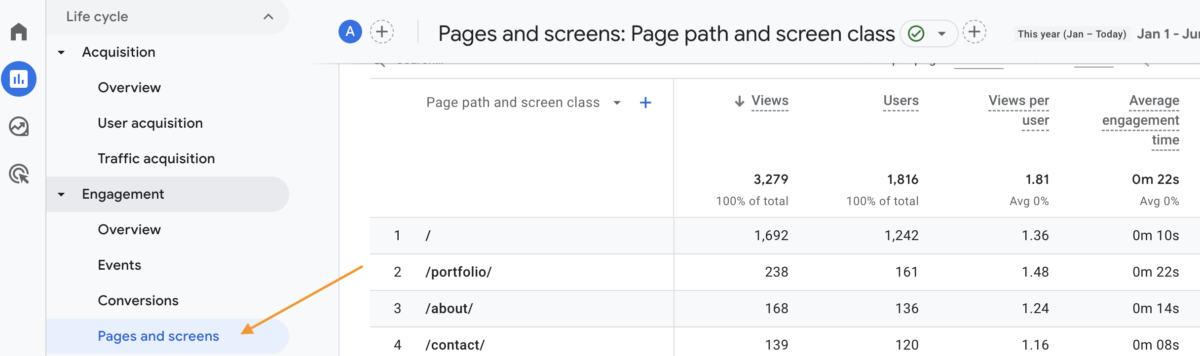
You can also report on all page interaction events in the Engagement section to see what interactions people are having with your website to help you understand your conversions and customer journey better.
4. Conversion & Event Reports
Reports > Engagement > Events or Goals
The Conversions and Events reports are arguably the most important GA4 reports as they allow you to easily track events such as page views, scrolls, outbound clicks, site search, video engagement, and file downloads within GA4.
You can then view this data in the events report.
When a user converts, you have a qualified lead that is more likely to complete a purchase or request a quote.
Learn how to set up a conversion5. User Reports
User reports show key information about the users who visit or use your site or app – demographics, such as users by country and city, gender, interests, age, and language.
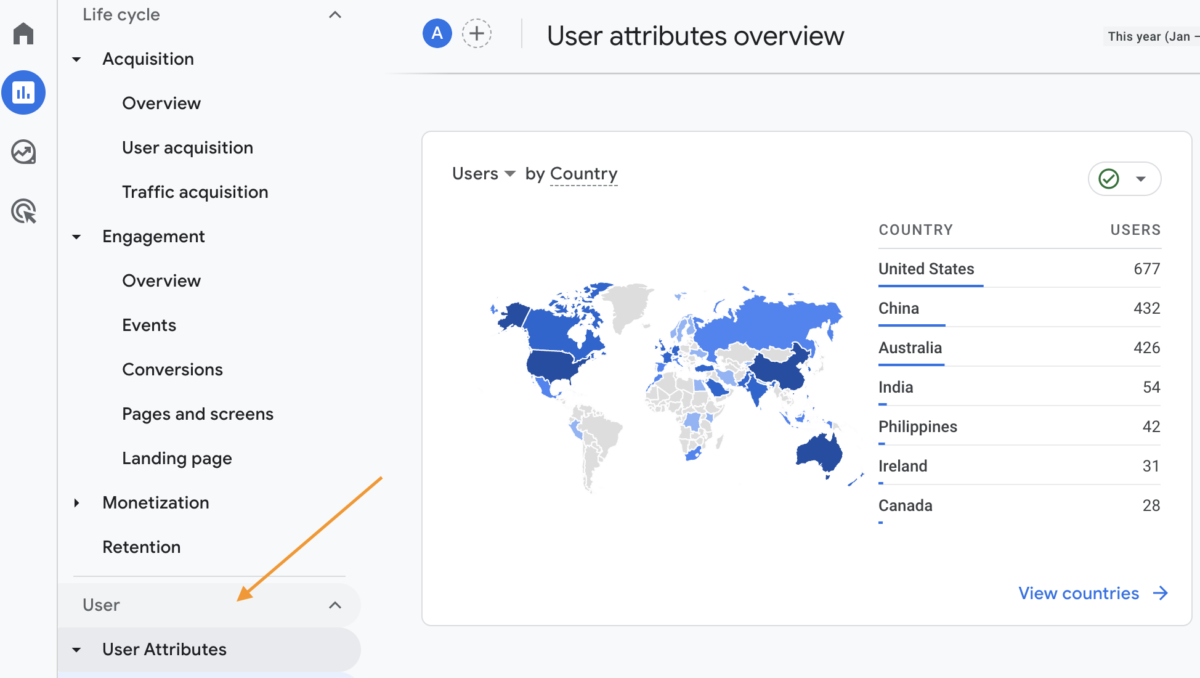
Google derives this data through a variety of means – from metrics gathered from hard data (e.g. a user’s language settings in their browser) to other metrics which a more “best guesses”.
So there you have it – our 5 top recommendations on the GA4 reports you should you be checking out to get started. GA4 is a powerful platform and there is tonnes more that it can do.
If you are interested in learning more – click the button below.
Comprehensive Beginner’s Guide to GA4